Tag Harmonization — Workflow Notebook
Process steps: ingest docs → convert to semantic library → deterministic functional descriptions → embeddings → functional equivalence matching → name harmonization overlay → label/alias.
Process Step 1 — Document ingestion
Ingest two asset documents. We record document size/complexity as experiment metadata.
Process Step 2 — Convert to semantic model (choose library)
Convert docs into a selected semantic library. For now: deterministic mock conversion for CIM / MTConnect / CoT to test each independently.
Process Step 3 — Functional canonicalization (deterministic)
Generate deterministic, library-native functional description text per signal. This is the canonical functionality representation used for retrieval and matching.
Math (cosine similarity)
Process Step 4 — Functional representation learning (embeddings)
Create one embedding per signal from the Step 3 canonical functional text. Embeddings are used primarily for candidate retrieval (top-k), not as the final equivalence decision.
Process Step 5 — Functional equivalence matching (ensemble + global constraints)
Decide functional equivalence using blocking + top‑k retrieval + composite scoring + global 1:1 matching. Canonical name overrides are never used for functional equivalence; they apply only to the post-match name-harmonization overlay.
Diagram (blocking → retrieval → global match)
flowchart LR
  A[Asset A signals] --> F{Family blocking}
  B[Asset B signals] --> F
  F --> C[Top-k candidate retrieval]
  C --> S[Composite scoring]
  S --> M[Global matching (1:1 + null)]
  M --> H[Name harmonization overlay]
Process Step 6 — Canonical name overrides (post-match overlay)
Update canonical/display names per asset signal. This affects name-harmonization only (downstream alias layer), never functional equivalence.
Tip: after saving overrides, re-run Step 5 to see canonical-name harmonization improve.
Charts
Server-rendered run summaries.
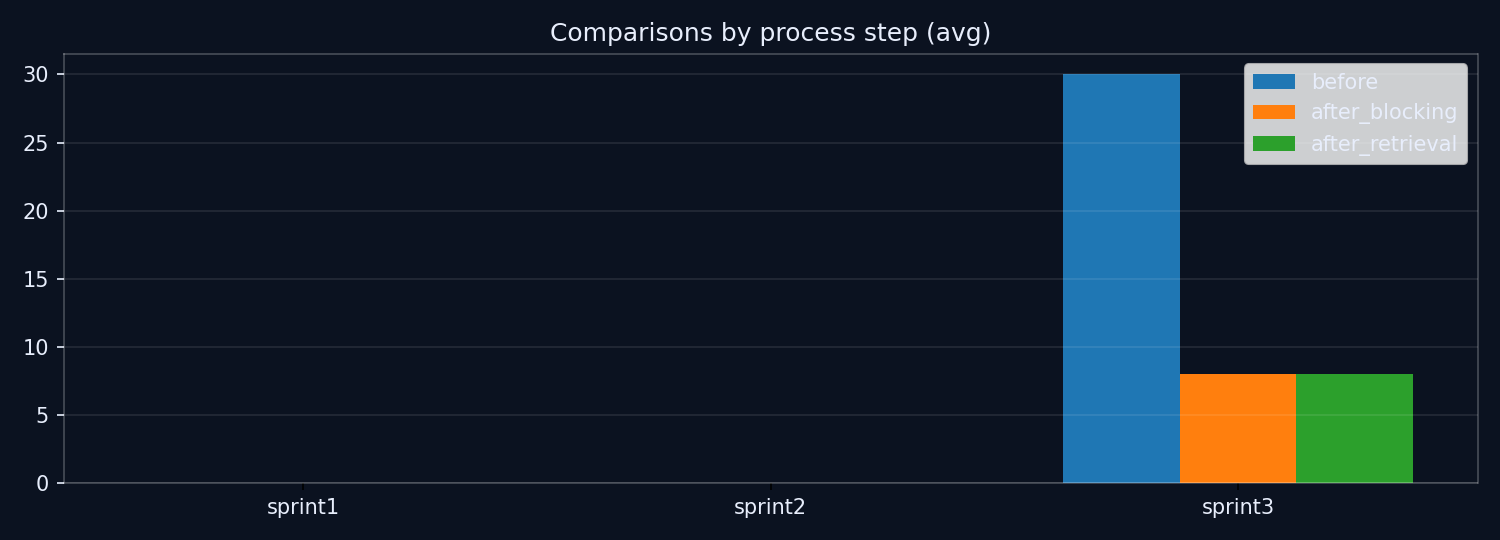
(Chart summarizes comparisons saved from run logs.)